Detection leads. Capture follows.
Governance makes it stick.
Sovel works with data you already have: exports and roster files you generate today, with a short path to first insight.
Detect knowledge risks from work order history
Upload a CSV or XLSX export of your work order history and maintenance team roster. Sovel's gap engine analyzes the data to surface prioritized knowledge risks from the rows you already have.
Recurring failures
Assets with repeated corrective work where troubleshooting steps still need to be written down.
Knowledge concentration
Critical tasks handled by a single technician — especially those approaching retirement.
Procedure drift
Patterns in work orders that suggest actual practice has diverged from documented SOPs.
High-cost blind spots
Expensive assets with poor troubleshooting coverage or excessive resolution times.
Retirement risk
Experienced technicians with deep expertise on critical assets who deserve a documented backup path.
Shadow work
Undocumented workarounds and tacit expertise that live outside the official system.
Capture expert context at the right moment
When a work order closes on a flagged issue, Sovel sends a targeted prompt to the technician who just did the work. Voice or text, 60 seconds, done — via link or SMS, lightweight by design.
Issue-aware prompts
Each prompt is tailored to the specific knowledge gap Sovel has identified — a targeted question tied to the issue on the board.
Selective by design
Sovel prompts rarely and only for high-signal gaps — enough to capture value, light enough to keep response rates high.
Voice or text
Record a short voice memo or type a few sentences. Sovel transcribes and structures it automatically.
Govern knowledge into operational artifacts
Every piece of captured knowledge enters a governed review workflow. A reviewer approves, edits, classifies the destination, and places it where it belongs. Every go-live runs through explicit human judgment.
Review inbox
Pending entries from technician capture, reviewer authoring, and promoted Q&A — all in one place.
Destination-aware output
Each approved entry is formatted for its target: asset notes, troubleshooting cards, WO notes, SOP deltas, or MOC drafts.
Placement tracking
Track whether approved knowledge has been exported, delivered, and acknowledged in the target system.
Full provenance
Who contributed, who approved, what changed, when it was placed. Audit trail from raw input to artifact.
Leadership metrics & knowledge graph
Maintenance leaders see whether knowledge is getting stronger or leaking: throughput from detection to placement, coverage, staleness, and concentration risk. Behind the scenes, assets, experts, and failure modes connect so you can see sole-expert risk and context in the same view as pipeline health.
See metrics & graph in the demoDestination-aware export
Approved knowledge is rendered for where it actually lives: CMMS notes, troubleshooting cards, work order context, SOP change proposals, or escalation paths. Export previews show exactly what reviewers will hand off.
Video walkthrough
Watch a 5-minute walkthrough of the full detect → capture → govern → place → monitor loop on real demo data.
Video walkthrough coming soon
What we measure in a pilot
-
≥20–40% reduction in reviewer edit rate on AI suggestions (quality/data score stable or improved)
-
Attributable MTTR lift on assets covered by governed corrections — deterministic issue IDs enable clean causal attribution
-
Governance velocity — issues governed per reviewer-hour rises as the flywheel engages
-
Proposal acceptance rate — % of suggestions accepted with minimal edit
-
Data quality composite — timeliness + completeness + accuracy + consistency uplift; reduced contradictions and drift
We present these as pilot targets, not historical outcomes. First pilot data will replace them.
Operations-floor wall display
A dark-mode command-center surface designed for the plant ops floor — issue velocity, MTTR trend, at-risk experts, and propagation corrections landing on the live knowledge graph. Ships when a pilot plant manager asks for the wall display.
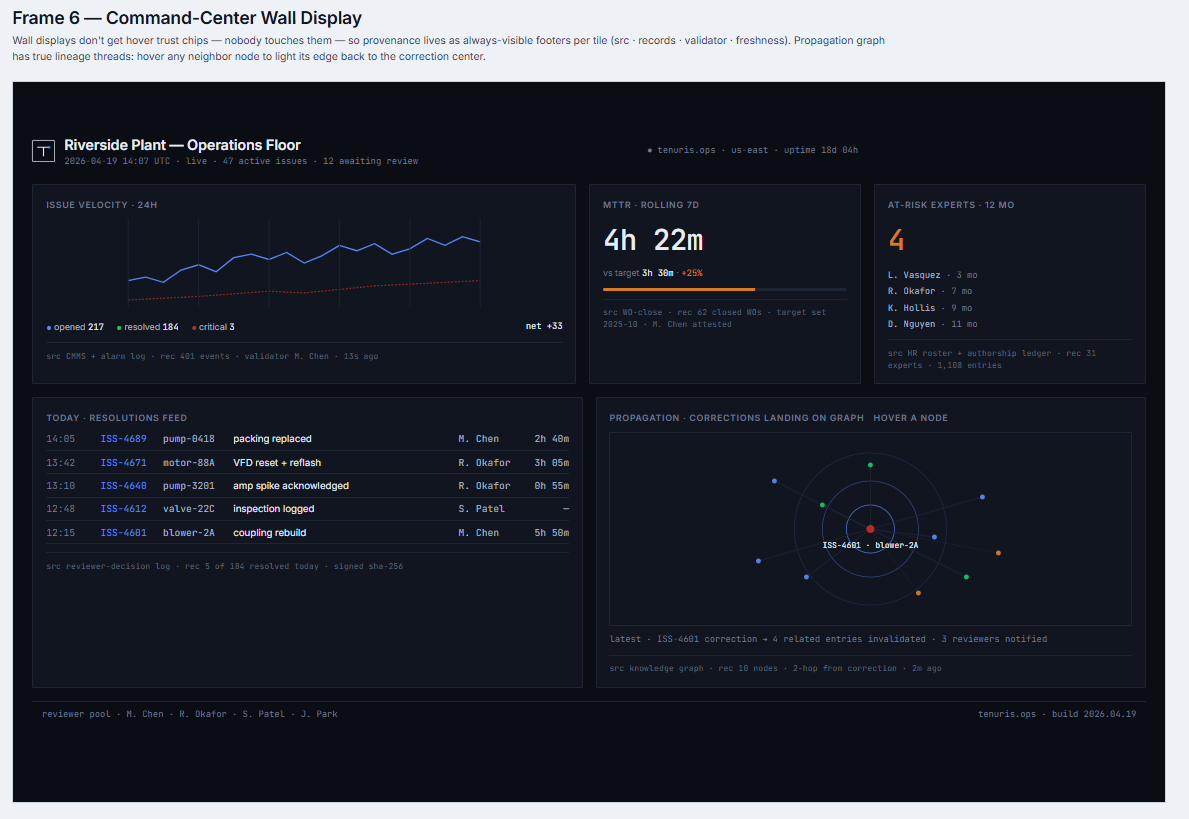
Frame 6 · demand-gated production port per roadmap #40.8
Ready to see what your data reveals?
Send a work order export and we'll run a free diagnostic focused on insight you can use in a short review.